E-Mail Campaign Report
- Melih Ayhan (Unlicensed)
- Nurçin Kandemir (Unlicensed)
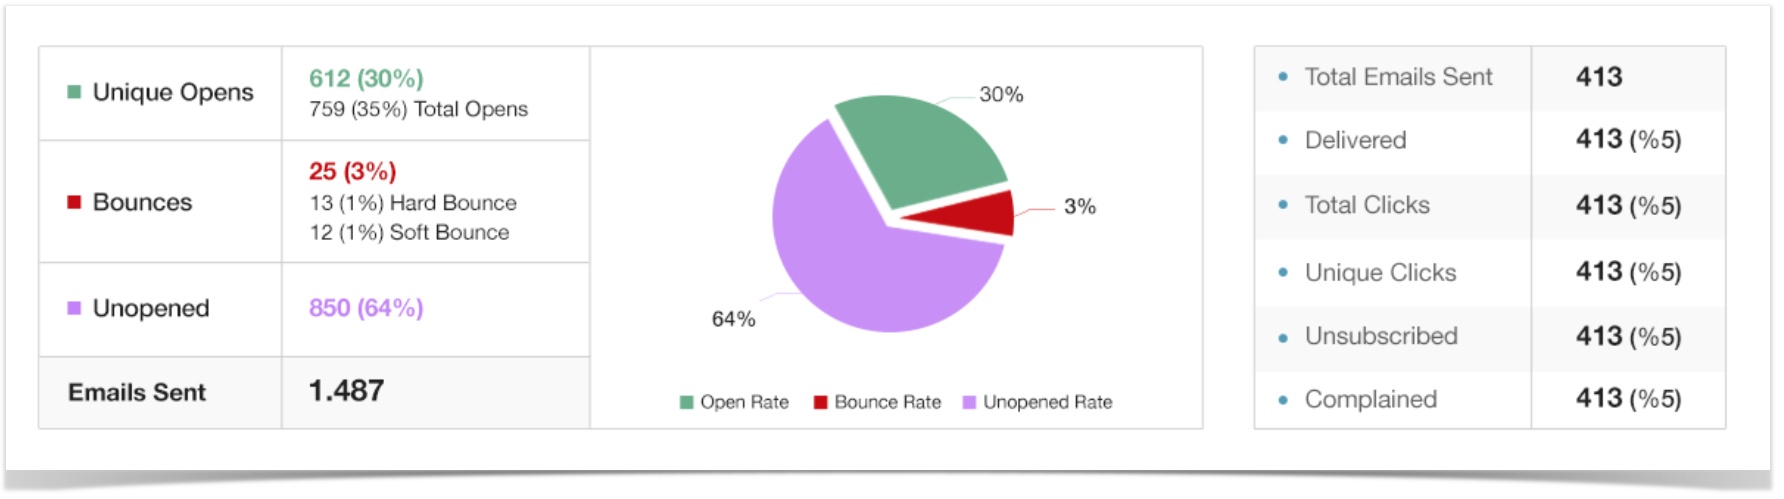
Recipient Activity Reporting
This report gives you a quick overview of the relevance of your email campaign by showing how the recipients have reacted to it.
| Recipient Activities | Description |
|---|---|
| Unique Opens | The total number of recipients who opened your email message. Contacts that have opened the same email campaign twice only count as one open. |
| Unique Open Rate | The percentage of the recipients who opened one of your email messages. Contacts that have opened the same email campaign twice only count as one open. (Total unique opens / total sent) * 100 |
Total Opens | The total number of times that the email message has been opened. Regardless of how many times a contact opens the email message, every time is counted. |
| Total Open Rate | The percentage of the total number of times that the email message has been opened. Regardless of how many times a contact opens the email message, every time is counted. (Total opens / total sent) * 100 |
| Bounces | The number of recipients who did not receive the email campaign as intended because it bounced. This can be either a soft bounce or a hard bounce. |
| Bounce Rate | The percentage of recipients who did not receive the email campaign as intended because it bounced. This can be either a soft bounce or a hard bounce. |
| Hard Bounce | These emails could not be delivered because the email address does not exist (or has been deleted). |
| Soft Bounce | These emails could not be delivered because of temporary problems, such as:
|
| Unopened | We cannot confirm that these recipients have opened the email, for one of the following reasons:
|
| Emails Sent | This is the number of emails which were sent out from the RMC mail servers. This includes all the emails delivered as well as bounced. |
| Delivered | The total number of email messages that were delivered successfully. |
| Delivery Rate | Percentage of the number of email messages that were delivered successfully. |
| Total Clicks | The number of times that a link in the email message has been clicked. Regardless of how many times a recipient clicks a link in an email message, every time is counted. |
| Total Click Rate | The percentage of the number of times a link in the email message has been clicked. Regardless of how many times a recipient clicks a link in an email message, every time is counted. (Total clicks / total sent) * 100 |
| Unique Clicks | The number of recipients who opened and clicked a link in the email campaign. Contacts that have clicked more than one link in the same email campaign only count as one click. |
| Unique Click Rate | The percentage of the recipients who opened and clicked a link in the email campaign. Contacts that have clicked more than one link in the same email campaign only count as one click. (Total unique clicks / total sent) * 100 |
| Unsubscribed | The number of recipients who have unsubscribed from the email campaign by clicking the Unsubscribe link in the email message. |
| Unsubscribe Rate | The percentage of recipients who have unsubscribed from the email campaign by clicking the Unsubscribe link in the email message. (Total unsubscribed / total sent) * 100 |
| Complained | The number of recipients who marked this email as spam or junk in their email client. |
Links Clicked
Click tracking allows you to see if your recipients have clicked links in your campaign.

- People Clicked – The number of recipients who opened and clicked a link in the email campaign.
- Total Clicks – The total number of unique clicks.
- Clicks Per Person – Average of all those who clicked (Total clicks / People Clicked)
- Didn’t click – The number of recipients who have not been tracked for one of the following reasons:
- They have not opened the email or clicked a trackable link.
- There are no trackable links in the content they received.
- Their emails were bounced.
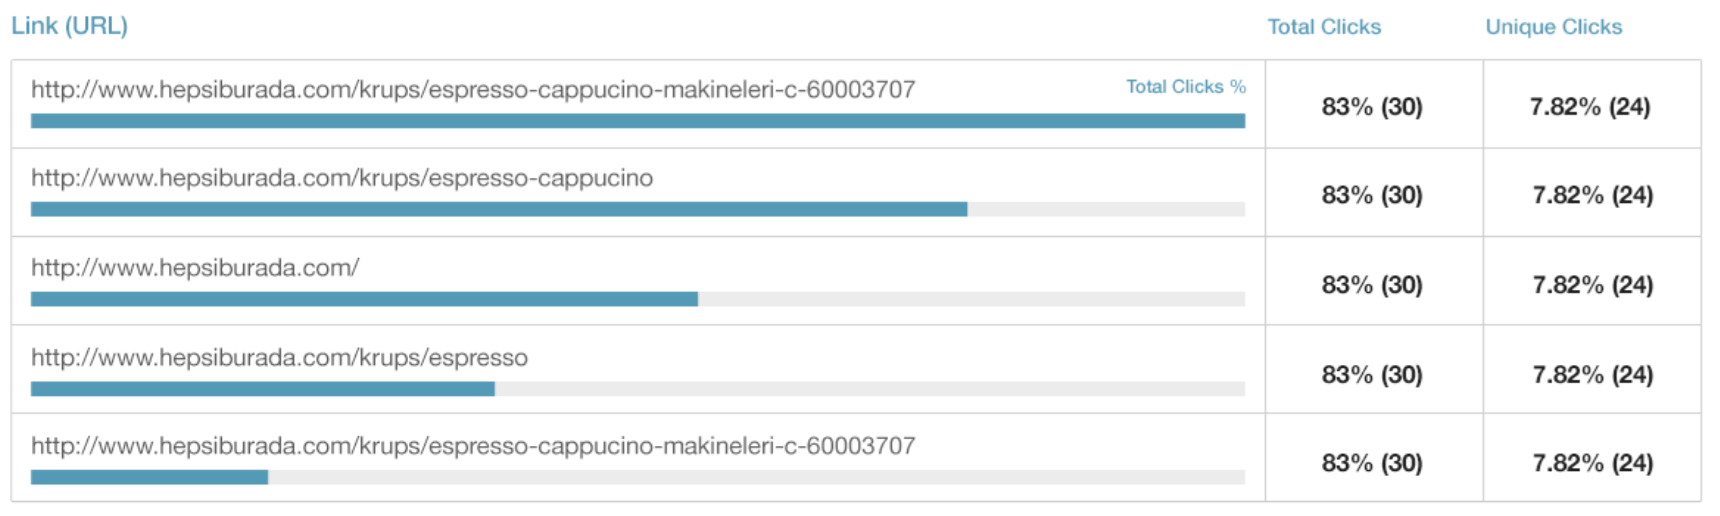
Most Clicked Links
This section of the recipient activity report displays the URLs that where clicked the most and the number of total and unique clicks for each.
How can these metrics help me?
If you send multiple pieces of content in your newsletters, or include multiple links in your promotional campaigns, then understanding exactly what links users are clicking can help you make design and structure changes that positively impact your click-through rate and other key metrics.
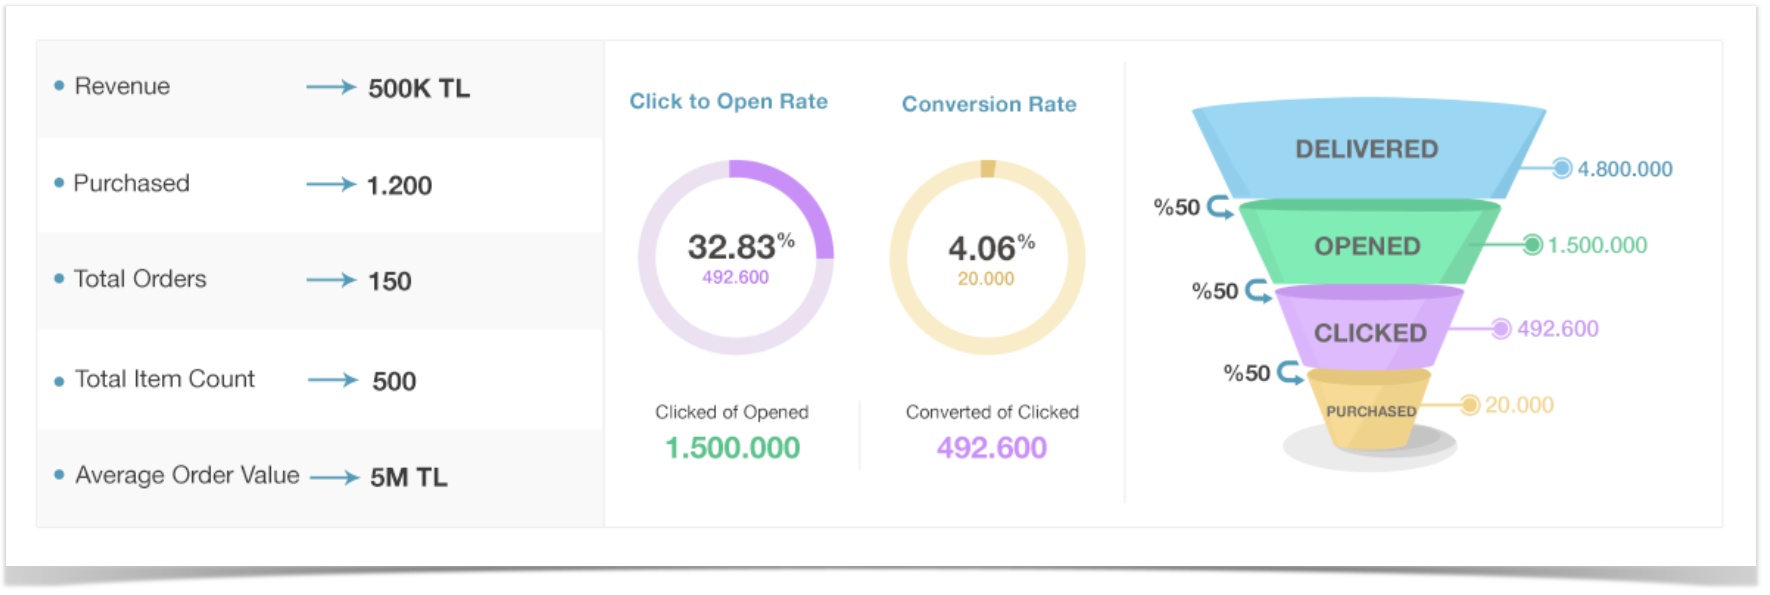
Revenue Reporting
You'll need to enable Google Analytics link tracking in your campaign for data to appear here.
This report provides detailed information about how much web traffic and revenue your campaigns generate. Revenue in this report is the total value of revenue generated by recipients who click a link in your email campaign to visit your site and complete a purchase.
| Revenue Reporting | Description |
|---|---|
| Revenue | Total revenue your email campaign has generated. |
| Purchased | The number of recipients who made a purchase attributed to this email campaign. |
| Total Orders | Total number of order your email campaign has generated. |
| Total Item Count | Total number of items purchased. |
| Average Order Value | Average value of the orders placed by recipients. Revenue / Total orders |
| Click To Open Rate | The relevance of the email campaign calculated by how many of the recipients who opened the email message also clicked a link. (Total clicks / total opens) * 100 |
| Conversion Rate | Purchases on your website driven by this email campaign, calculated by by how many of the recipients who clicked the email message also made a purchase. (Purchased / clicked) * 100 |
| Delivered | The total number of email messages that were delivered successfully. |
| Opened | The total number of recipients who opened your email message. Contacts that have opened the same email campaign twice only count as one open. (unique opens) |
| Clicked | The number of recipients who opened and clicked a link in the email campaign. Contacts that have clicked more than one link in the same email campaign only count as one click. (unique clicks) |
| Purchased | The number of recipients who made a purchase attributed to this email campaign. |
| Visits | The number of recipients that visited your website by clicking a link in the email message. |
How can these metrics help me?
If, like most marketers, the main goal of your email marketing campaigns is to ultimately help drive sales & revenue for your business, then the metrics in the revenue reporting will be very useful to you as it can give you quantifiable data on your overall return on investment.
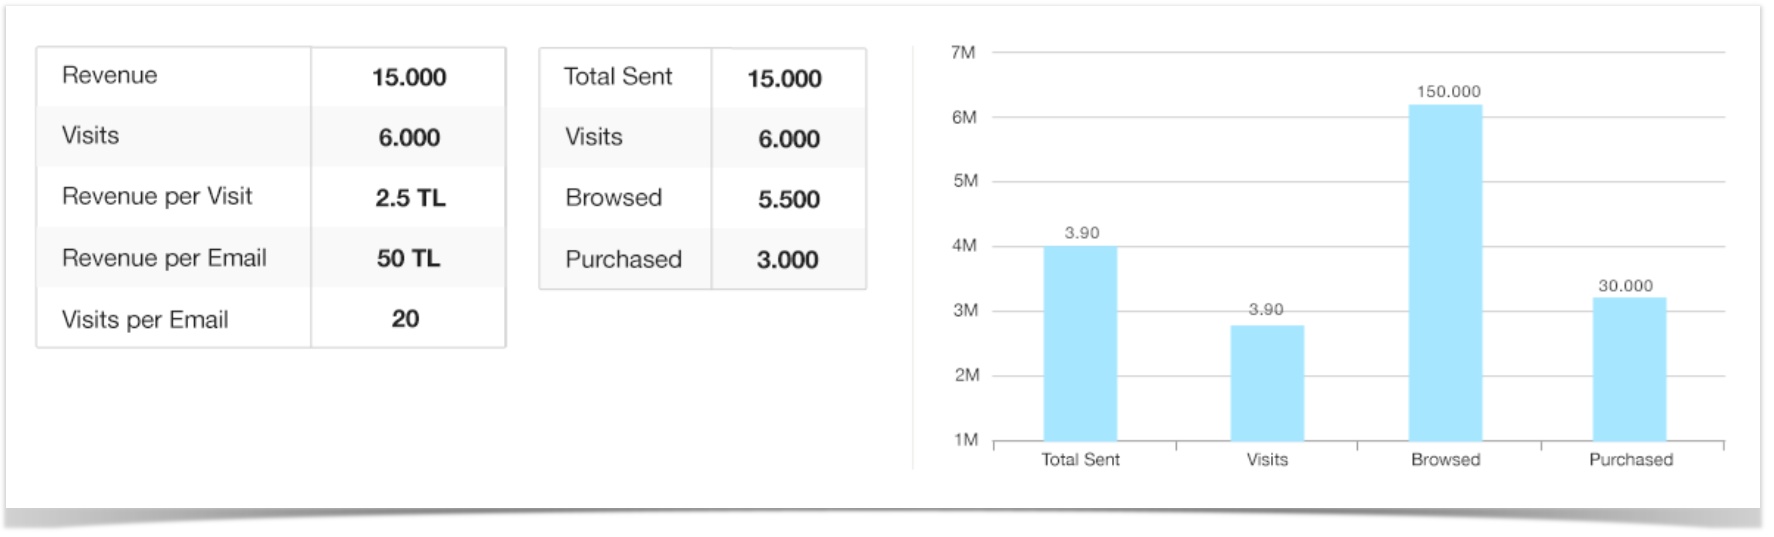
Revenue and Visits
Revenue and visits gives you an overview of the total revenue and the total number of visits that your email campaign has generated.
| Revenue and Visits | Description |
|---|---|
| Revenue | Total revenue your email campaign has generated. |
| Visits | The number of recipients that visited your website by clicking a link in the email message. |
| Revenue per Visit | The average value per visit that visits from your email campaign have generated. Visits / Revenue |
| Visits per Email | The average number of visits the email campaign has generated. Visits / Total Sent |
| Total Sent | The number of email messages that have been sent in the email campaign. |
| Browsed | The number of recipients who viewed more than one page after coming to your website through a link in the email message. |
| Purchased | The number of recipients who made a purchase attributed to this email campaign. |
How can these metrics help me?
If your goal with email is to drive people to your website, the revenue and visits reporting provides a useful metrics for comparing how email performs against other channels, like search engines and social media, when it comes to driving visits to your site.
Technology Reporting
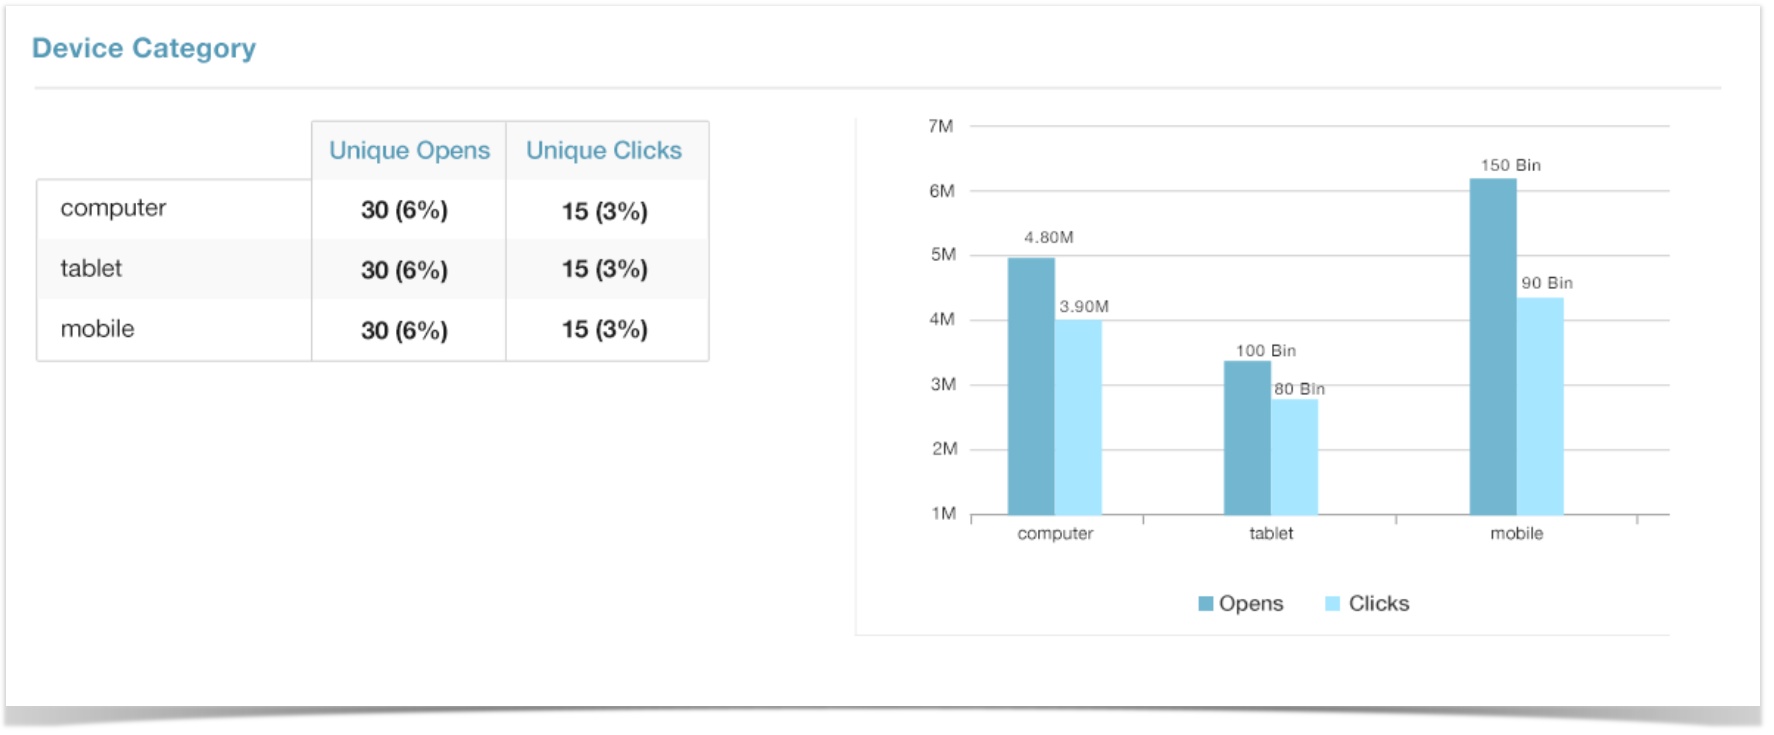
This report displays data according to device, operating system, and browser.
- The Device category displays the number of opened email campaigns and the number of clicks grouped by the type of device that the contacts have used.
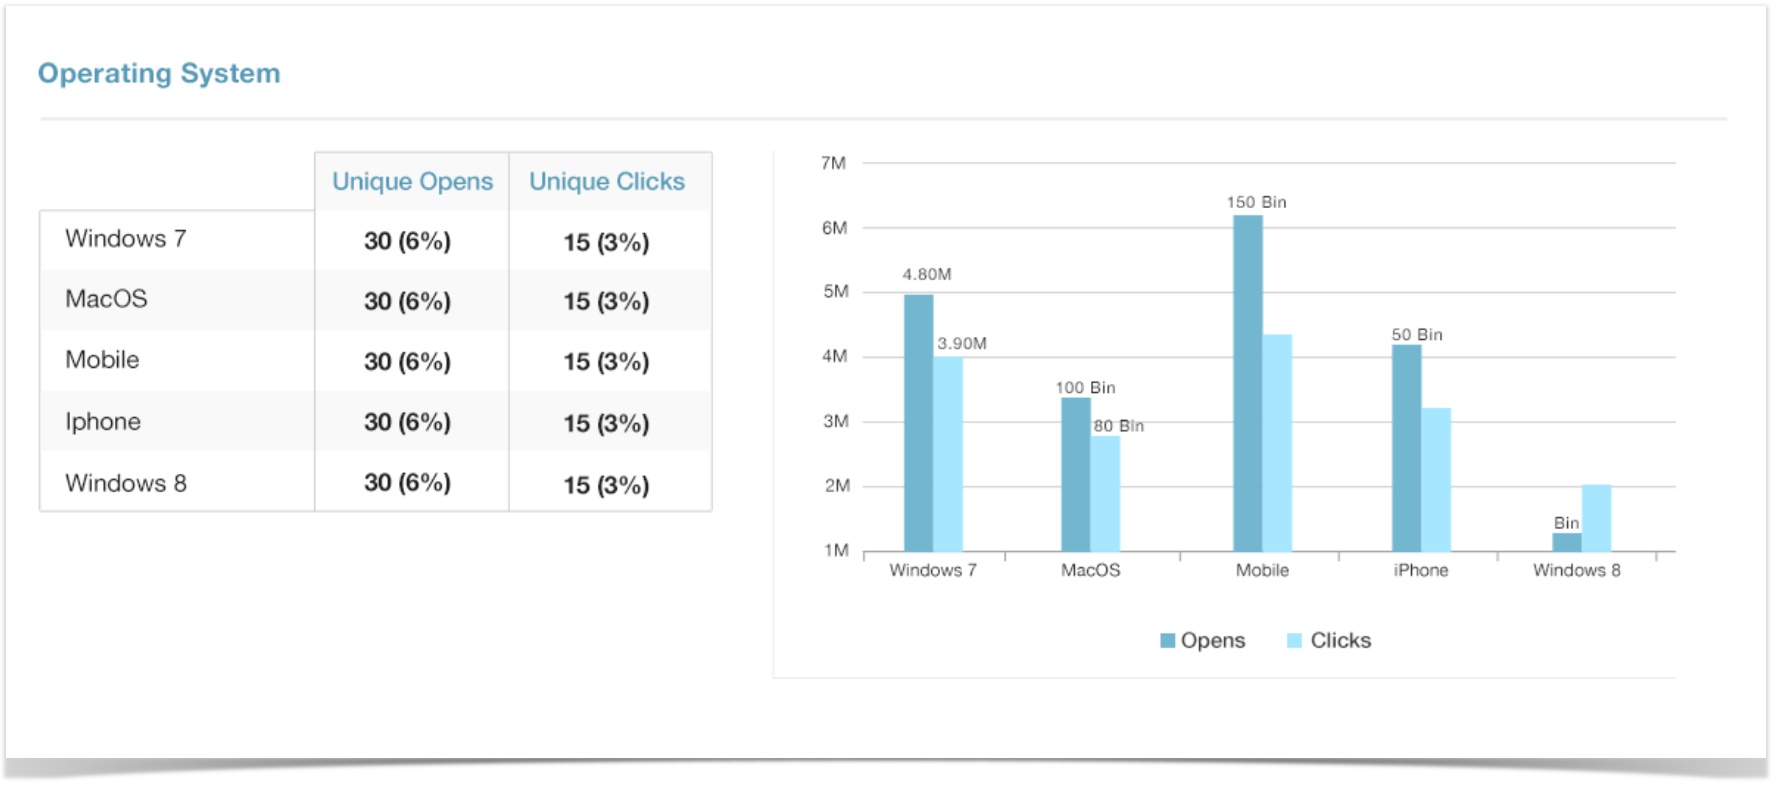
- The Operating System category displays the number of opened email campaigns and the number of clicks according to the operating system that the contacts have used.
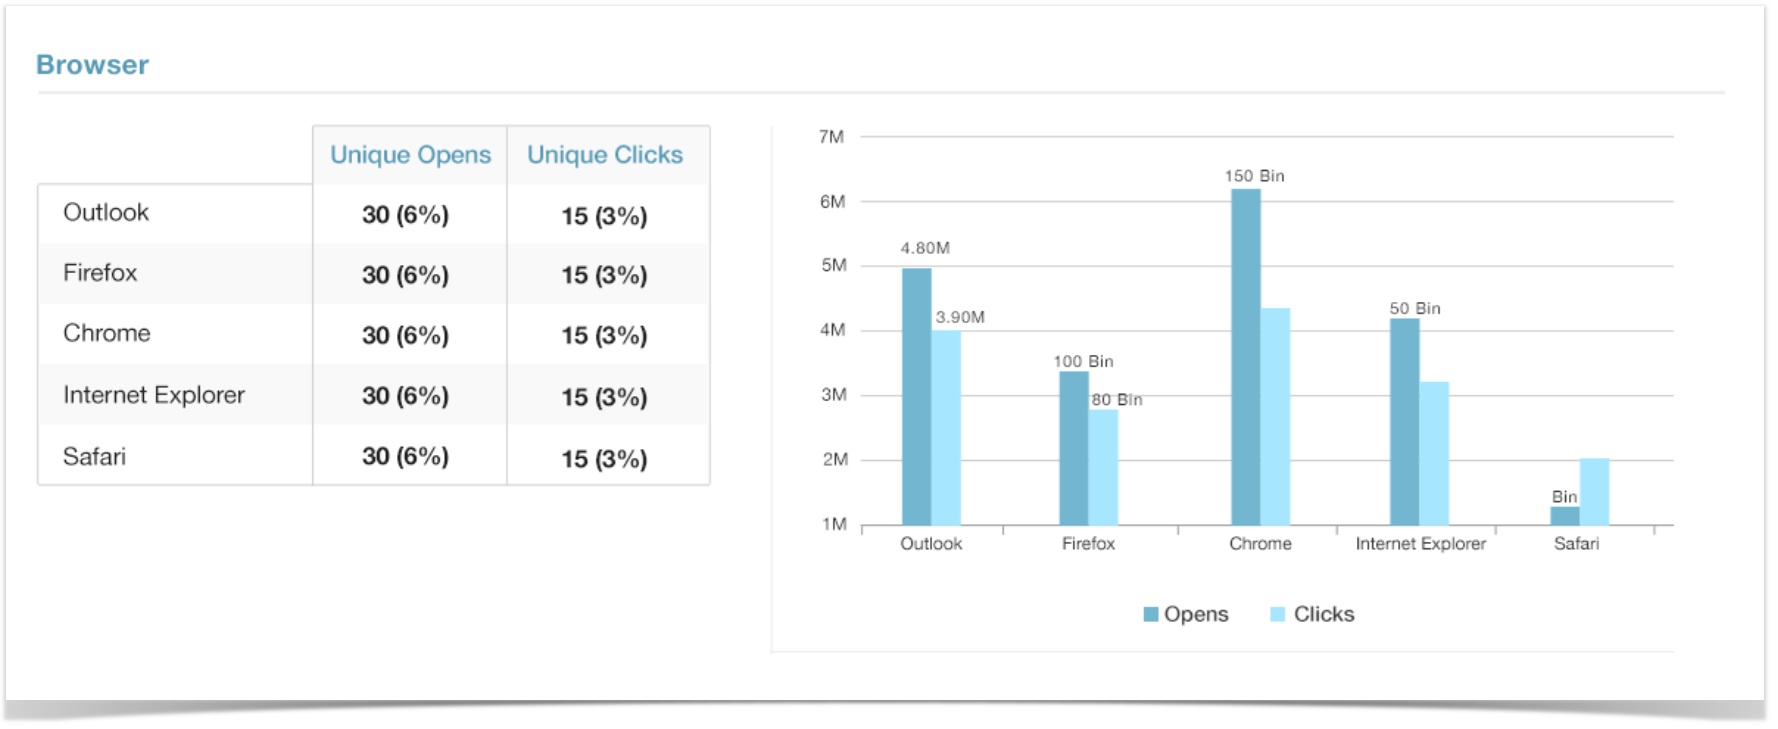
- The Browser category displays the number of opened email messages and the number of clicks according to the recipient's browser.
How can these metrics help me?
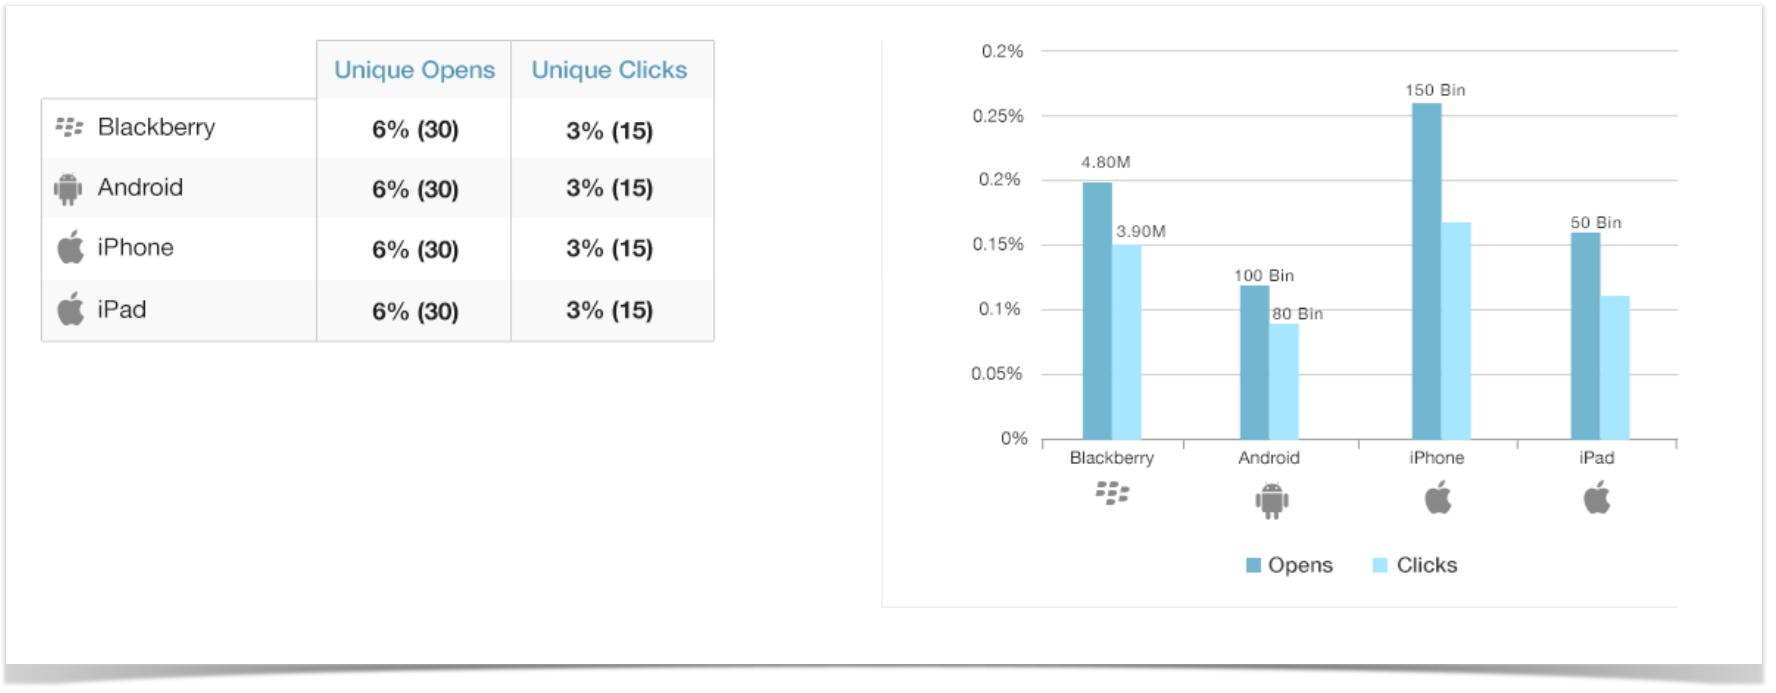
Mobile Reporting
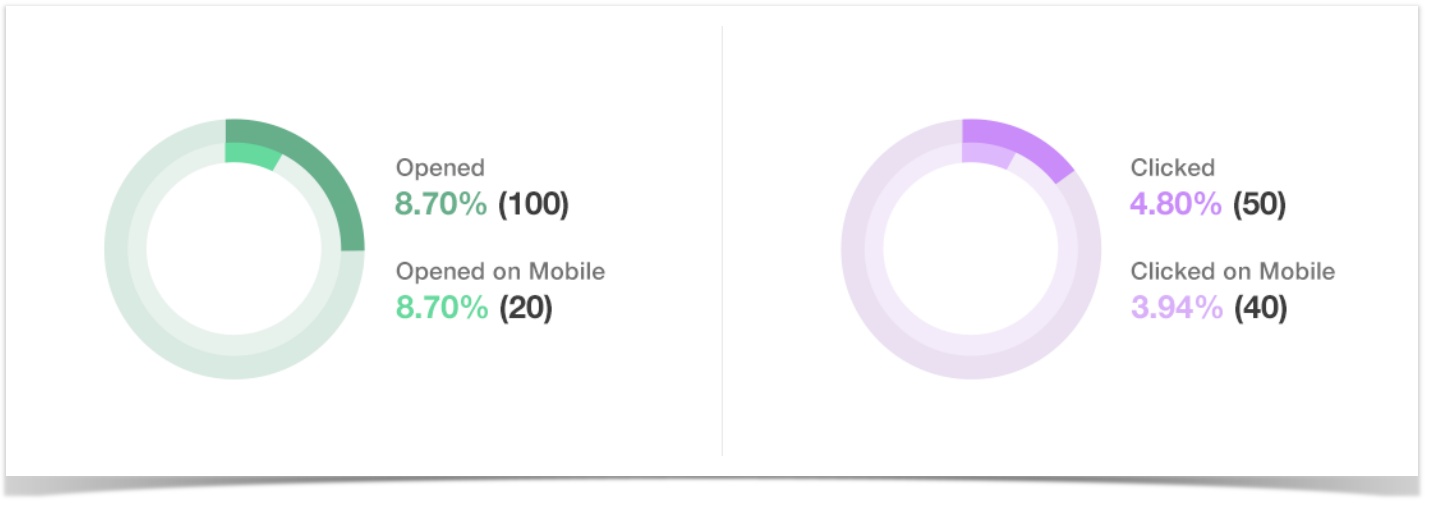
Mobile reporting shows you how many recipients opened and clicked your campaign on a mobile device.
| Mobile Reporting | Description |
|---|---|
| Opened | The percentage and number of recipients who opened your email message. (unique opens) |
| Opened on Mobile | The perentage and number of recipients who opened your email message on a mobile device. |
| Clicked | The percentage and number of recipients who clicked your email message. (unique clicks) |
| Clicked on Mobile | The percentage and number of recipients who clicked your email message on a mobile device. |
Distribution by Client
This section of the mobile reporting displays the mobile devices used and the number of total and unique clicks for each.
Location Reporting
Displays where in the world your subscribers are opening your campaigns. We use geolocation tracking to collect your subscribers' location information and the name of the country subscribers are from.
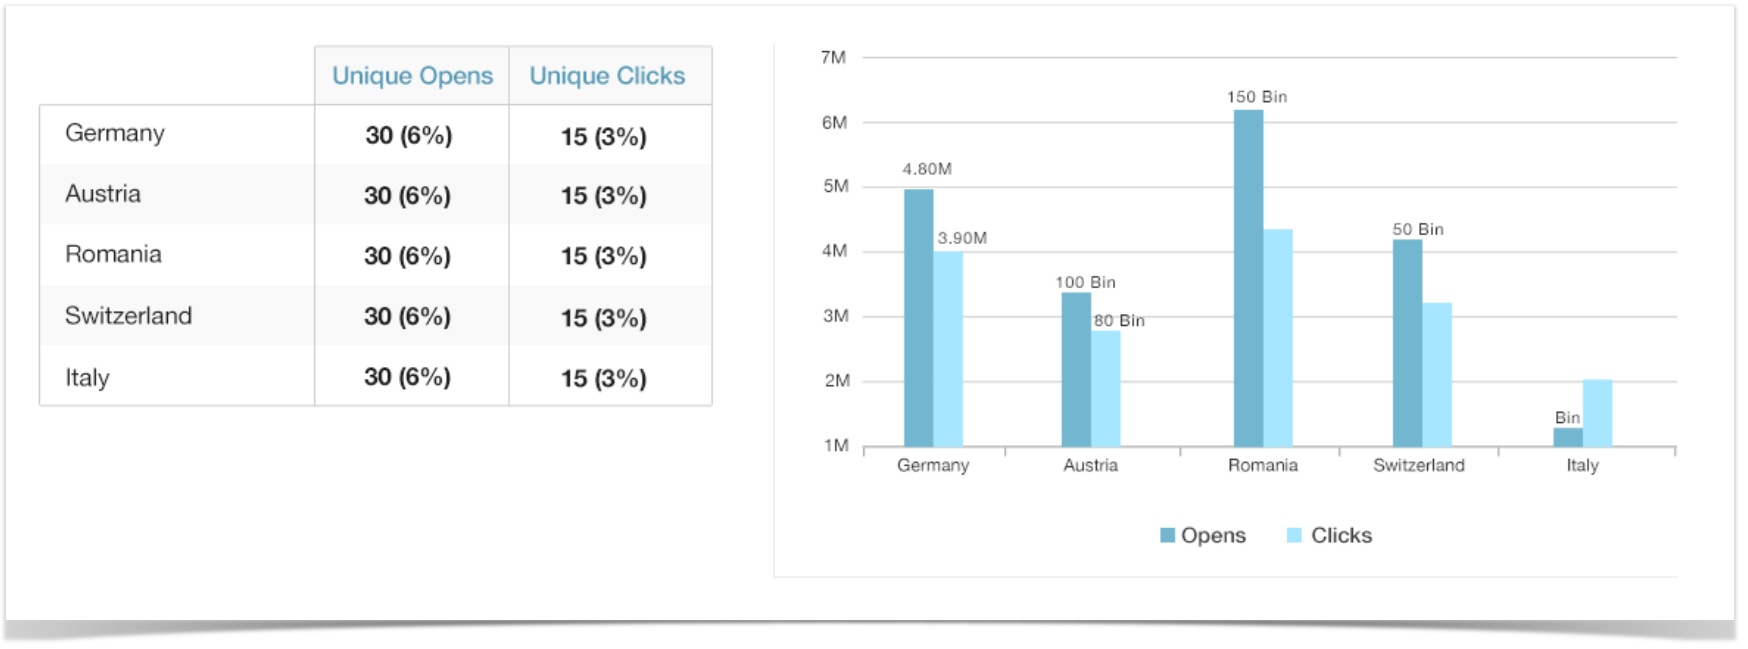
How can these metrics help me?
See where in the world your subscribers are located and track engagement by country, then adjust your content or segment accordingly.
Opens and Clicks Over Time
This report helps you identify trends in when your campaigns are being opened and engaged with. Opens and Clicks Over Time report provides opens and clicks by day and hour for this email campaign.
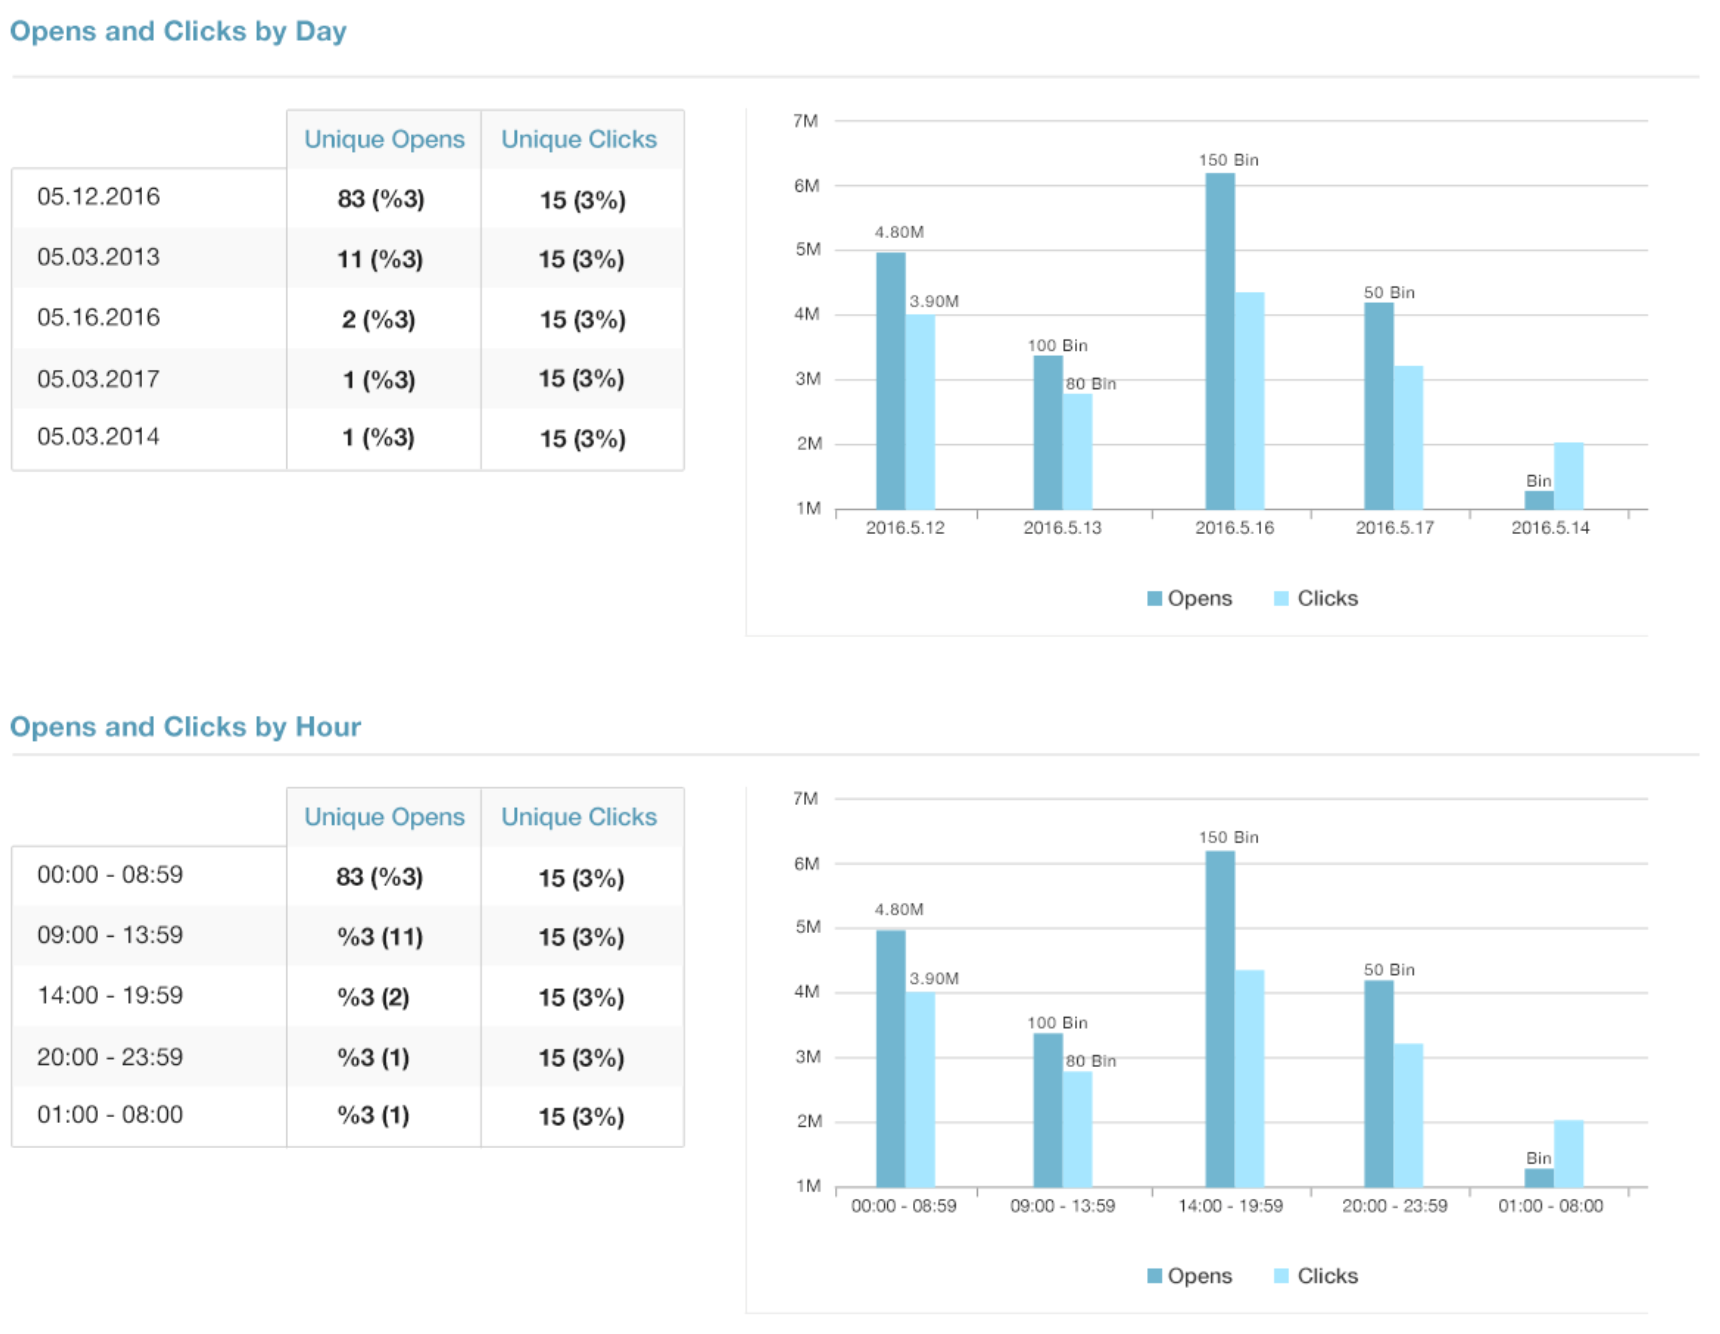
How can these metrics help me?
Depending on the size of your lists, you may have subscribers in all different timezones across the globe.
These people are inherently going to be reading email at different times, and it’s important to understand those times and factor them into when you send your campaigns.
With insights from this report, you can optimise the time you send your email campaigns. For instance, while there will always be a big spike when you first send your campaign, if you see that you get another spike several hours later it might be worth testing sending your next campaign at that time and measure whether it has a positive effect on your key metrics like open and click-through rates.
Copyright 2020 Related Digital